Billing Time
One of the many valuable features of todo.vu is the ability to track your time. Adding beef to this benefit are the billing reports. Here you can dig into that captured data to create comprehensive billing reports for your clients. These reports can be tailored to either provide a detailed report or a simple overview of the project and hours you are billing for. The reports are then converted into a beautiful reader-friendly format which can be sent as a URL to your clients.
The Billing Dashboard
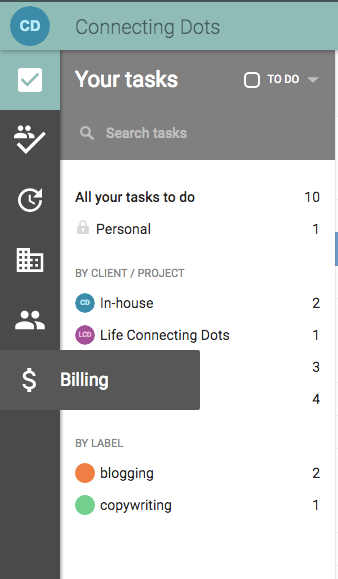
To access the Billing page, click on the $ icon on the left sidebar.
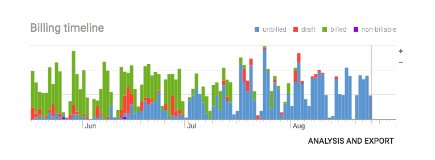
Billing timeline
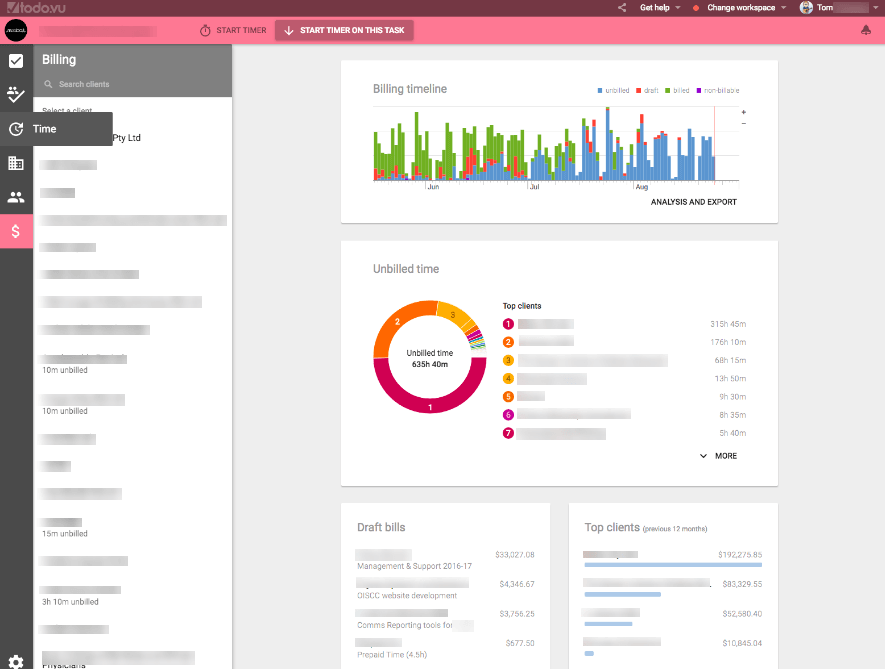
Once you select a client from the left-hand side, you will see your graphs populate in the main view section.
The first graph up the top is the ‘Billing timeline’. This graph shows a chart of your billing progress.
Each horizontal line to the right of the chart represents 10 hours of time.
You will notice various colours in the chart. The colours represent:
- Blue: Unbilled – A billing report has not been created.
- Red: Draft – A billing report draft has been created but not sent.
- Green: Created – Billing report has been created and sent.
- Purple: Non-billable – This section measures the time spent on tasks which is not billable to the client.
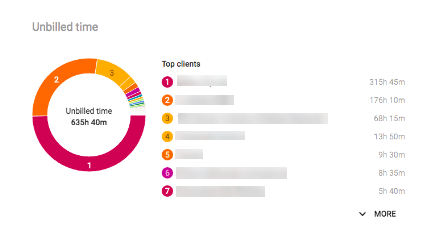
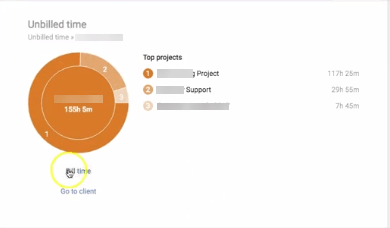
Unbilled time
Moving down our page, beneath Billing timeline, we have ‘Unbilled time’. You will see a pie chart including your top clients that you have not yet billed. This section is designed to give you an easy visual of all the work you have not yet billed, as well as the ability to dig deeper into the information.
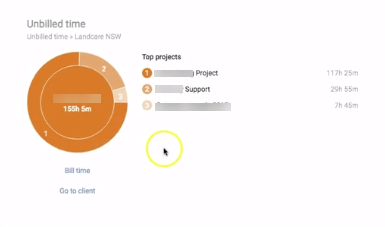
1. Client drill down
Clicking on a particular client will allow you to see in greater detail the projects that are yet to be billed. This will be represented through the pie chart. Once you are in the project you can click on the individual tasks to drill further into the information.
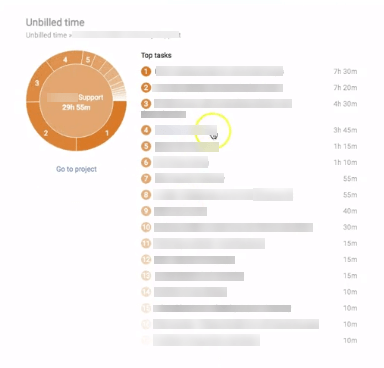
2. Project drill down
Drilling down further, you can click on the project to go into the tasks.
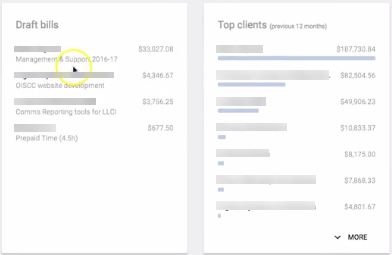
Draft bills and Top clients
Below Unbilled time, you will see a column for Draft bills and Top clients. These are quick reference tools to remind you when you have drafts that you have not sent and to quickly see who your top clients are based on hours in the past 12 months.
How to create a billing report
Remaining in the ‘Unbilled time’ section, once you have selected the client you wish to create a billing report for, you can click on the ‘Bill time’ button.
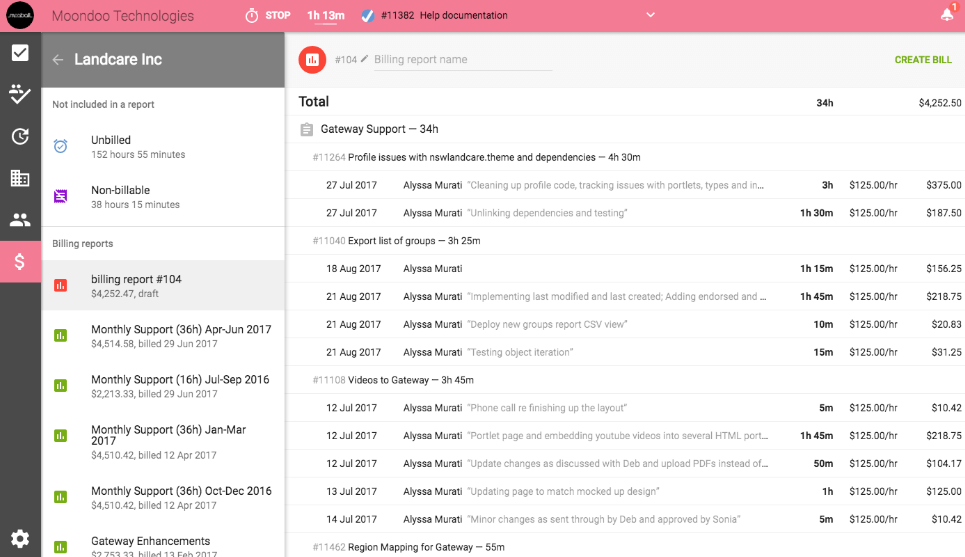
Navigating the left column
On the left-hand side, you will see at the top ‘Not included in a report’. Underneath this is Unbilled and Non-Billable. Unbilled is where all of your logged time is stored and waiting for you to review and create billing reports for your clients.
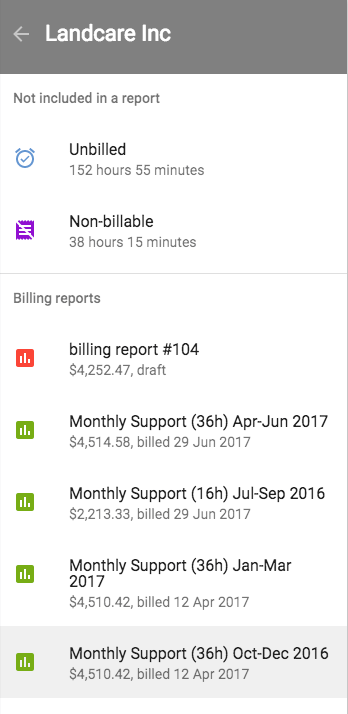
Non-billable is for hours logged that are not billable to a client. This option exists so that you are able to monitor and manage your own, or your team members hours, even those that you cannot charge to clients.
Billing reports is where you will find all of your previous billing reports. These can be selected to open up the comprehensive report and dig deeper into the data. If you partially create a report and aren’t able to complete it, you will find the draft in this section in red. Completed reports are green.
Unbilled
You can see in the main view section a list of all your unbilled time. In here you can select an individual time entry, an entire task, an entire project or you can work your way through the list selecting individual tasks.
Once you have selected the items you wish to bill for, you will see a menu bar pop up down the bottom.

- Add to a new report – this is what you will select to create a new billing report.
- Change rate – here you can then edit from this page the billing rates.
- Non-billable – this will move those entries to Non-billable. If you do this by accident you can go into the Non-billable tab to the left to find them and correct.
Filters
Date range selector
The Date range selector, found on the top right, allows you to apply filters to the entries in your main view. Perhaps you want to look at only the last month or you need to look at the entire financial year, then maybe you need to drill further into that to find entries only by one particular staff member. Here is where you are able to deep dive into your data.
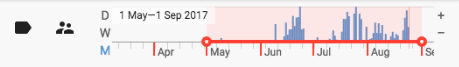
- D, W, M = Day, Week and Month.
Label and staff filter
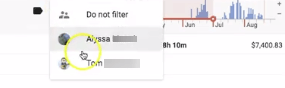
To the left of the graph, you will see a few icons. The Label icon, the Person icon. Let’s explore these:
- Label icon – Here you can filter the entries in your main view by selecting a label. You can label tasks to reflect the needs of your business and make searching more sophisticated. Perhaps “deployed” or “awaiting client response”.
- People icon – Here you will find a list of your staff members. You can filter the results below to include only those completed by a specific staff member. Allowing you to send separate billing reports for different staff if required by the client.
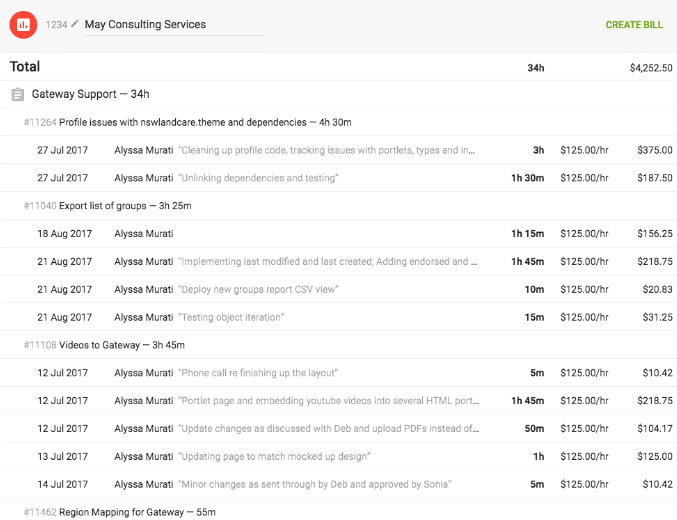
Congratulation – You have created a new billing report.
Note – all past Billing reports can be viewed from the left-hand column.
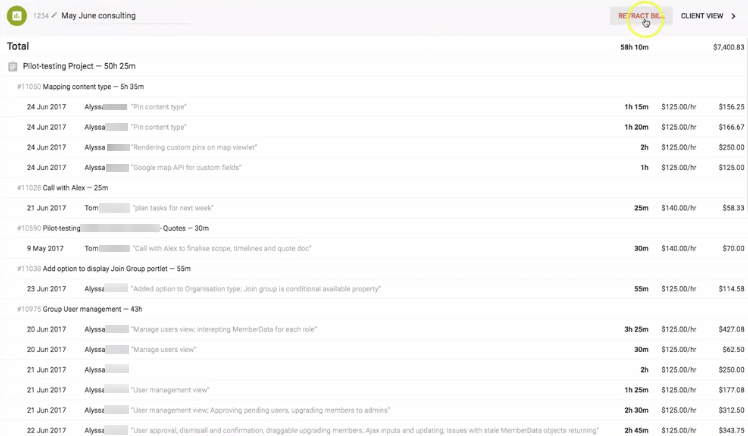
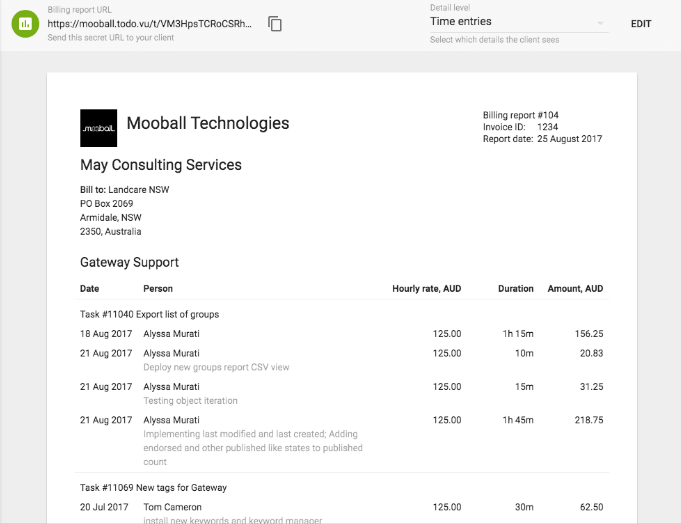
Editing Published Billing Report
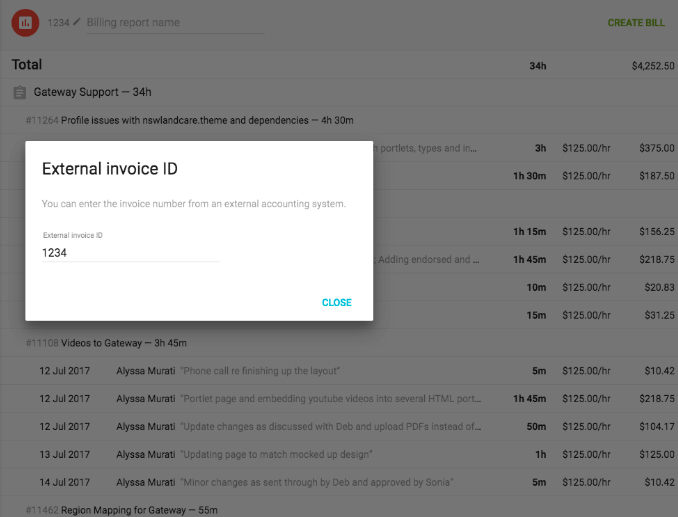
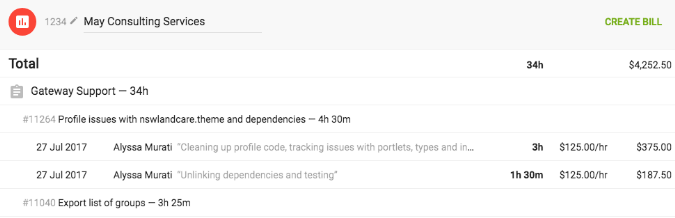
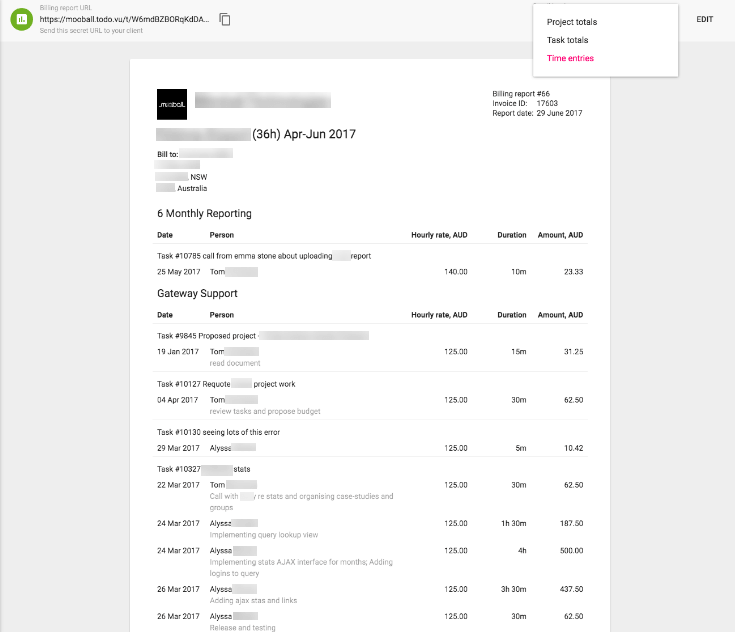
By default, the billing report will show all entries. You can, however, edit this. All edits happen in real-time so even if you have sent a link to a client and wish to edit, the client will see those changes as soon as they are applied.
Selecting Retract bill will move it back into a draft state, which you will be able to see on the left-hand side under Billing reports.